通过定义顶点来绘制形状
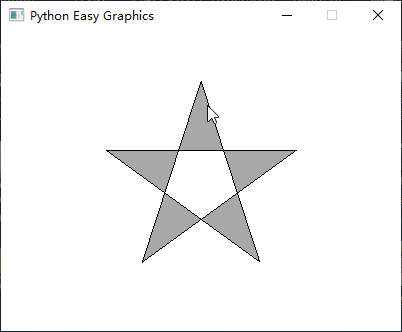
我们可以通过给出顶点的位置,来绘制复杂的形状
下面的代码绘制了一个五角星。
提示:
- 我们用for循环定义了五角星的5个顶点。
- **我们将end_shape()的参数设为True,以绘制一个封闭的图形。如果你要绘制一个不封闭的复合线(Polyline),请使用end_shape()的缺省参数False。
- 如果你不想填充绘制出来的形状,那么end_shape()时不要封闭形状。也可以通过将填充色设为Color.TRANSPARENT(透明)来实现不填充的效果。
from easygraphics import *

def main():
    init_graph(400,300)
    set_color(Color.BLACK)
    set_fill_color(Color.LIGHT_GRAY)
    # set the axis origin to (200,150)
    translate(200, 150)
    begin_shape()
    for i in range(5):
        vertex(0,-100)
        rotate(144)
    end_shape(True)
    pause()
    close_graph()

easy_run(main)
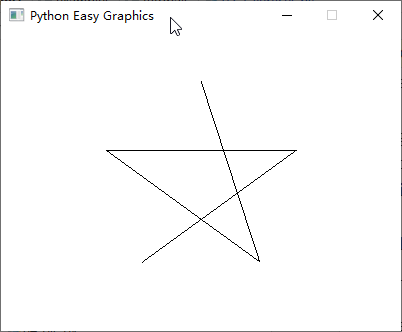
看看如果end_shape()时不封闭形状,画出来的形状什么样。
from easygraphics import *

def main():
    init_graph(400,300)
    set_color(Color.BLACK)
    set_fill_color(Color.LIGHT_GRAY)
    # set the axis origin to (200,150)
    translate(200, 150)
    begin_shape()
    for i in range(5):
        vertex(0,-100)
        rotate(144)
    end_shape()
    pause()
    close_graph()

easy_run(main)
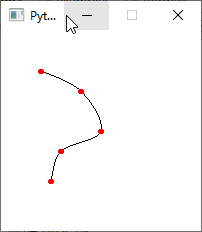
样条曲线(Catmull-Rom曲线)
我们可以使用顶点定义来绘制Catmull-Rom样条曲线。
from easygraphics import *

def main():
    init_graph(200,200)
    set_color(Color.BLACK)
    set_fill_color(Color.LIGHT_GRAY)
    points = [(40,40),
              (80,60),
              (100,100),
              (60,120),
              (50,150)]

    # draw the curve
    begin_shape()
    curve_vertex(40,40) # the first control point is also the start point of the curve
    for point in points:
        curve_vertex(point[0],point[1])
    curve_vertex(50,150) # the last control point is also the end point of the curve
    end_shape()

    # draw control points
    set_fill_color(Color.RED)
    for point in points:
        fill_circle(point[0],point[1],3)

    pause()
    close_graph()

easy_run(main)
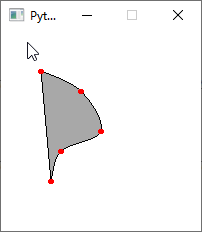
看看如果end_shape()时封闭形状,画出来的形状什么样。
from easygraphics import *

def main():
    init_graph(200,200)
    set_color(Color.BLACK)
    set_fill_color(Color.LIGHT_GRAY)
    points = [(40,40),
              (80,60),
              (100,100),
              (60,120),
              (50,150)]

    # draw the curve
    begin_shape()
    curve_vertex(40,40) # the first control point is also the start point of the curve
    for point in points:
        curve_vertex(point[0],point[1])
    curve_vertex(50,150) # the last control point is also the end point of the curve
    end_shape(True)

    # draw control points
    set_fill_color(Color.RED)
    for point in points:
        fill_circle(point[0],point[1],3)

    pause()
    close_graph()

easy_run(main)
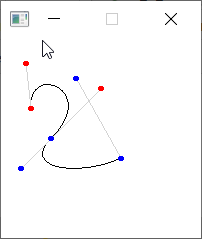
贝塞尔曲线(Bézier curve)
在下面的程序中,我们使用顶点定义来绘制一个三次贝塞尔曲线。
from easygraphics import *

def main():
    init_graph(200,200)

    #draw bezier curves
    set_color("black")
    set_fill_color("yellow")
    begin_shape()
    vertex(30, 70) # first point
    bezier_vertex(25, 25, 100, 50, 50, 100)
    bezier_vertex(20, 130, 75, 140, 120, 120)
    end_shape()

    # draw control lines
    set_color("lightgray")
    line(30,70,25,25)
    line(100,50,50,100)

    line(50,100,20,130)
    line(75,40,120,120)

    # draw control points
    set_fill_color("red")
    fill_circle(30,70,3)
    fill_circle(25,25,3)
    fill_circle(100,50,3)

    set_fill_color("blue")
    fill_circle(50,100,3)
    fill_circle(20,130,3)
    fill_circle(75,40,3)
    fill_circle(120,120,3)

    pause()
    close_graph()

easy_run(main)